Validation
Numbers you can verify
StatEze writes statistics into manuscripts, so the numbers have to be right. This page summarizes how we check them and how you can check them yourself.
What we check
Every statistical test family StatEze can run is checked against reference results computed independently of StatEze's own code. The reference values are produced outside StatEze and do not share its code, so agreement is evidence, not circularity. No test is available to users without a matching reference.
Worked examples. Recompute any of them.
Do not take our word for it. Each example below is a real analysis StatEze ran on a published clinical dataset: the chart it produced, the result it computed, and the data to reproduce it. Download the data, run it in SPSS, and check every number. Some results are strong and some are small, exactly as the data is.
These are real, widely cited datasets from the published clinical and teaching literature: the diabetes study from the Vanderbilt Biostatistics collection (Frank Harrell), the melanoma cohort from Andersen et al., the heart-failure cohort from the UCI Machine Learning Repository (Ahmad et al.), and the ACS registry from the moonBook clinical teaching dataset. They are the same starter datasets we load into every new StatEze account, not synthetic toy data. The test StatEze chose for each, and why, is shown under the chart.
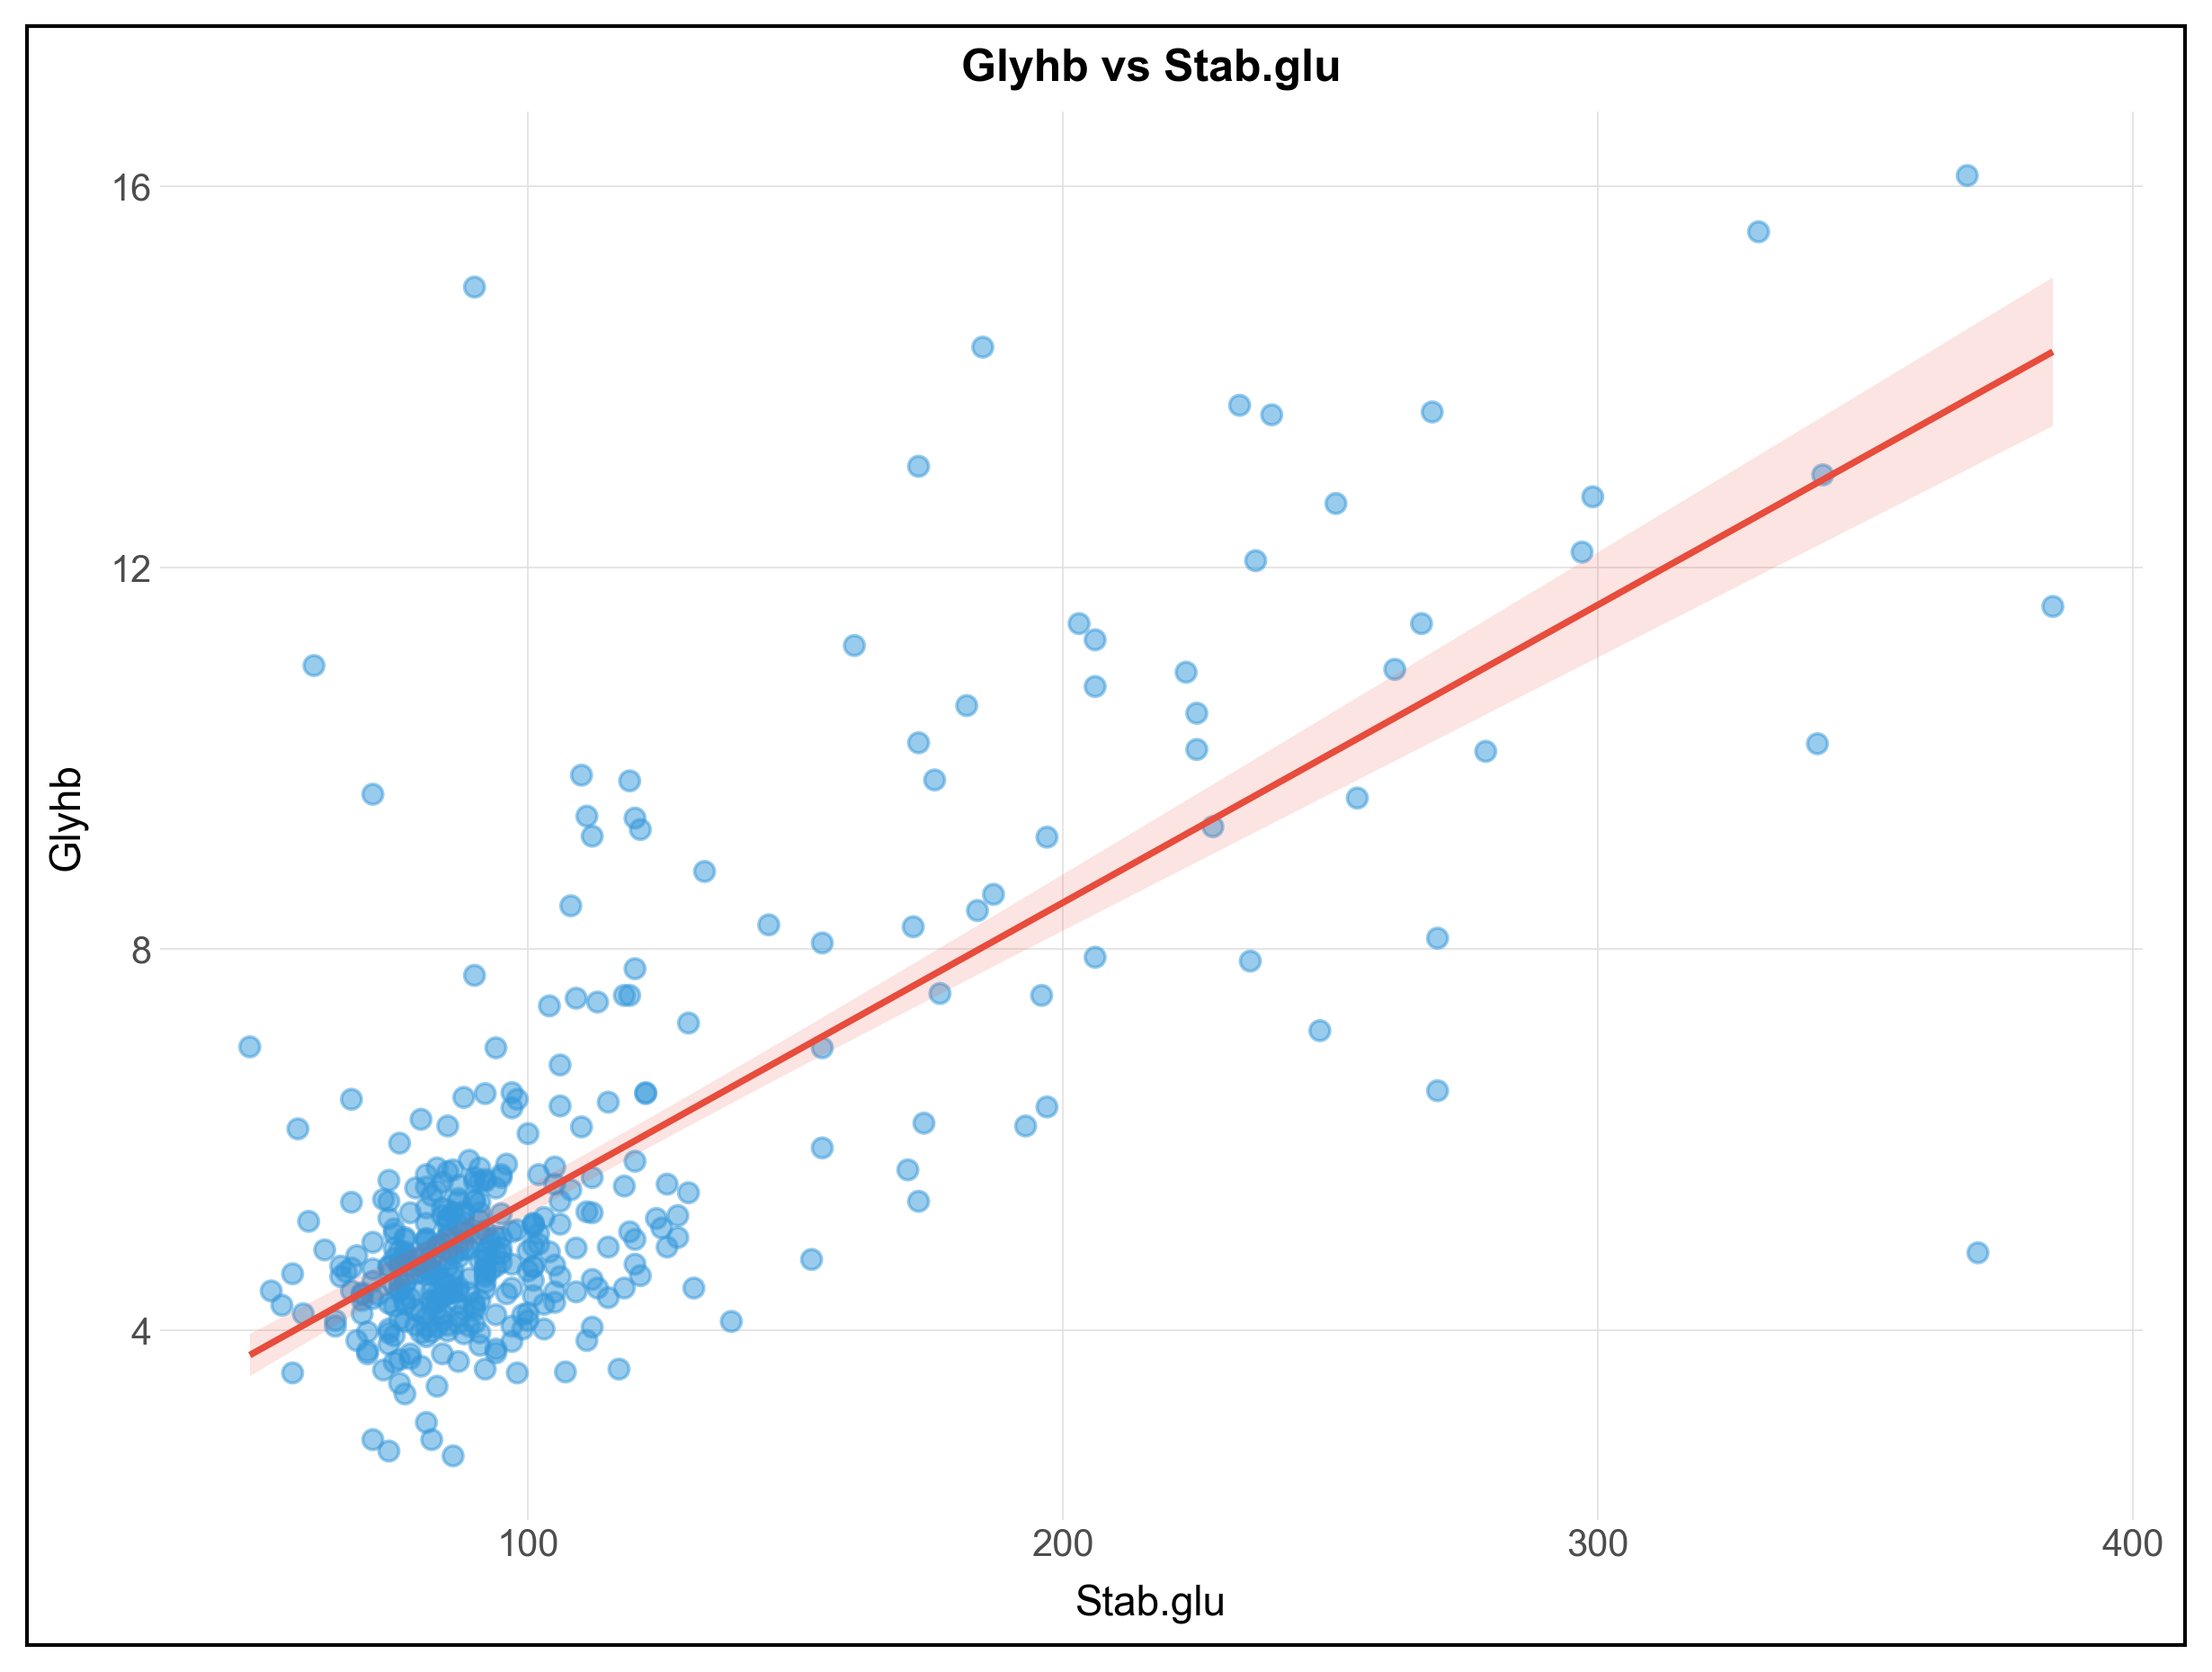
Pearson correlation · Vanderbilt diabetes study (n = 390)
Stabilized glucose and glycosylated hemoglobin (HbA1c) were strongly positively correlated; r = 0.75; P < .001.
Both variables continuous and approximately normal, so Pearson's correlation.
Download the data (CSV)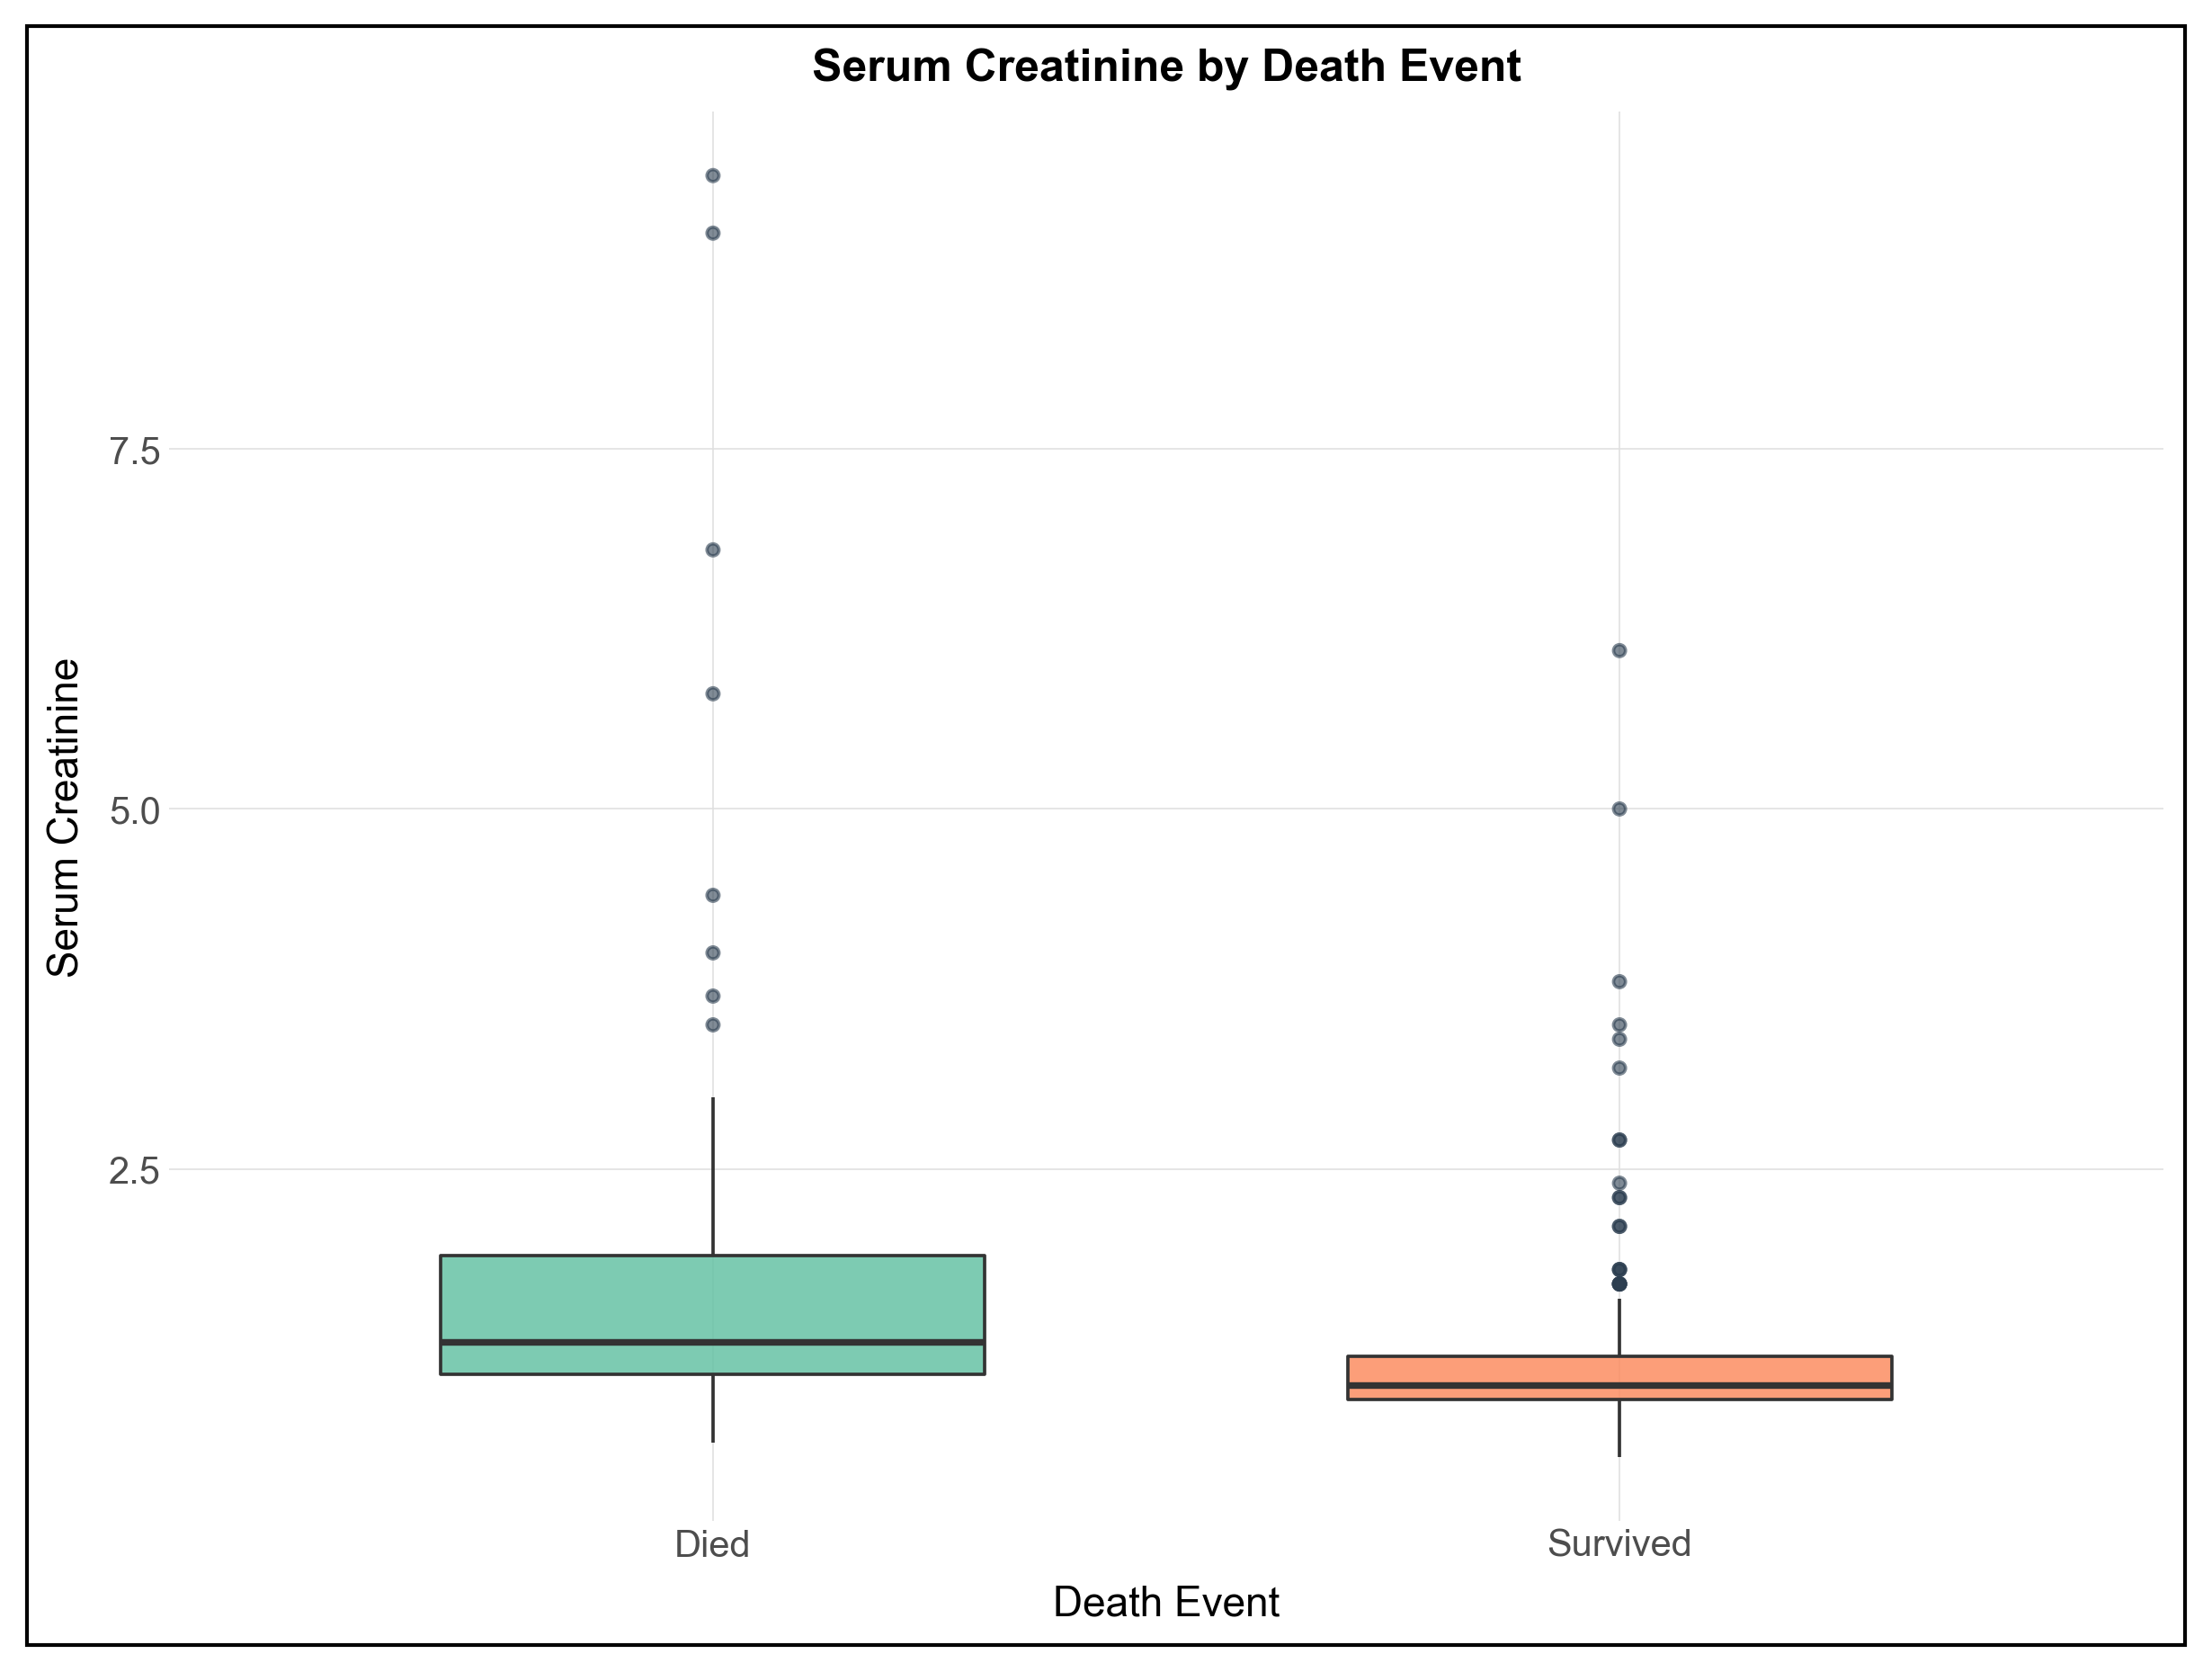
Mann-Whitney U · Heart-failure cohort (n = 299)
Serum creatinine was higher in patients who died than in survivors (median 1.30 vs 1.00 mg/dL); U = 14190; P < .001; r = 0.46.
Creatinine was non-normal in both groups (Shapiro-Wilk P < .001) with unequal variances (Levene P < .001), so Mann-Whitney U.
Download the data (CSV)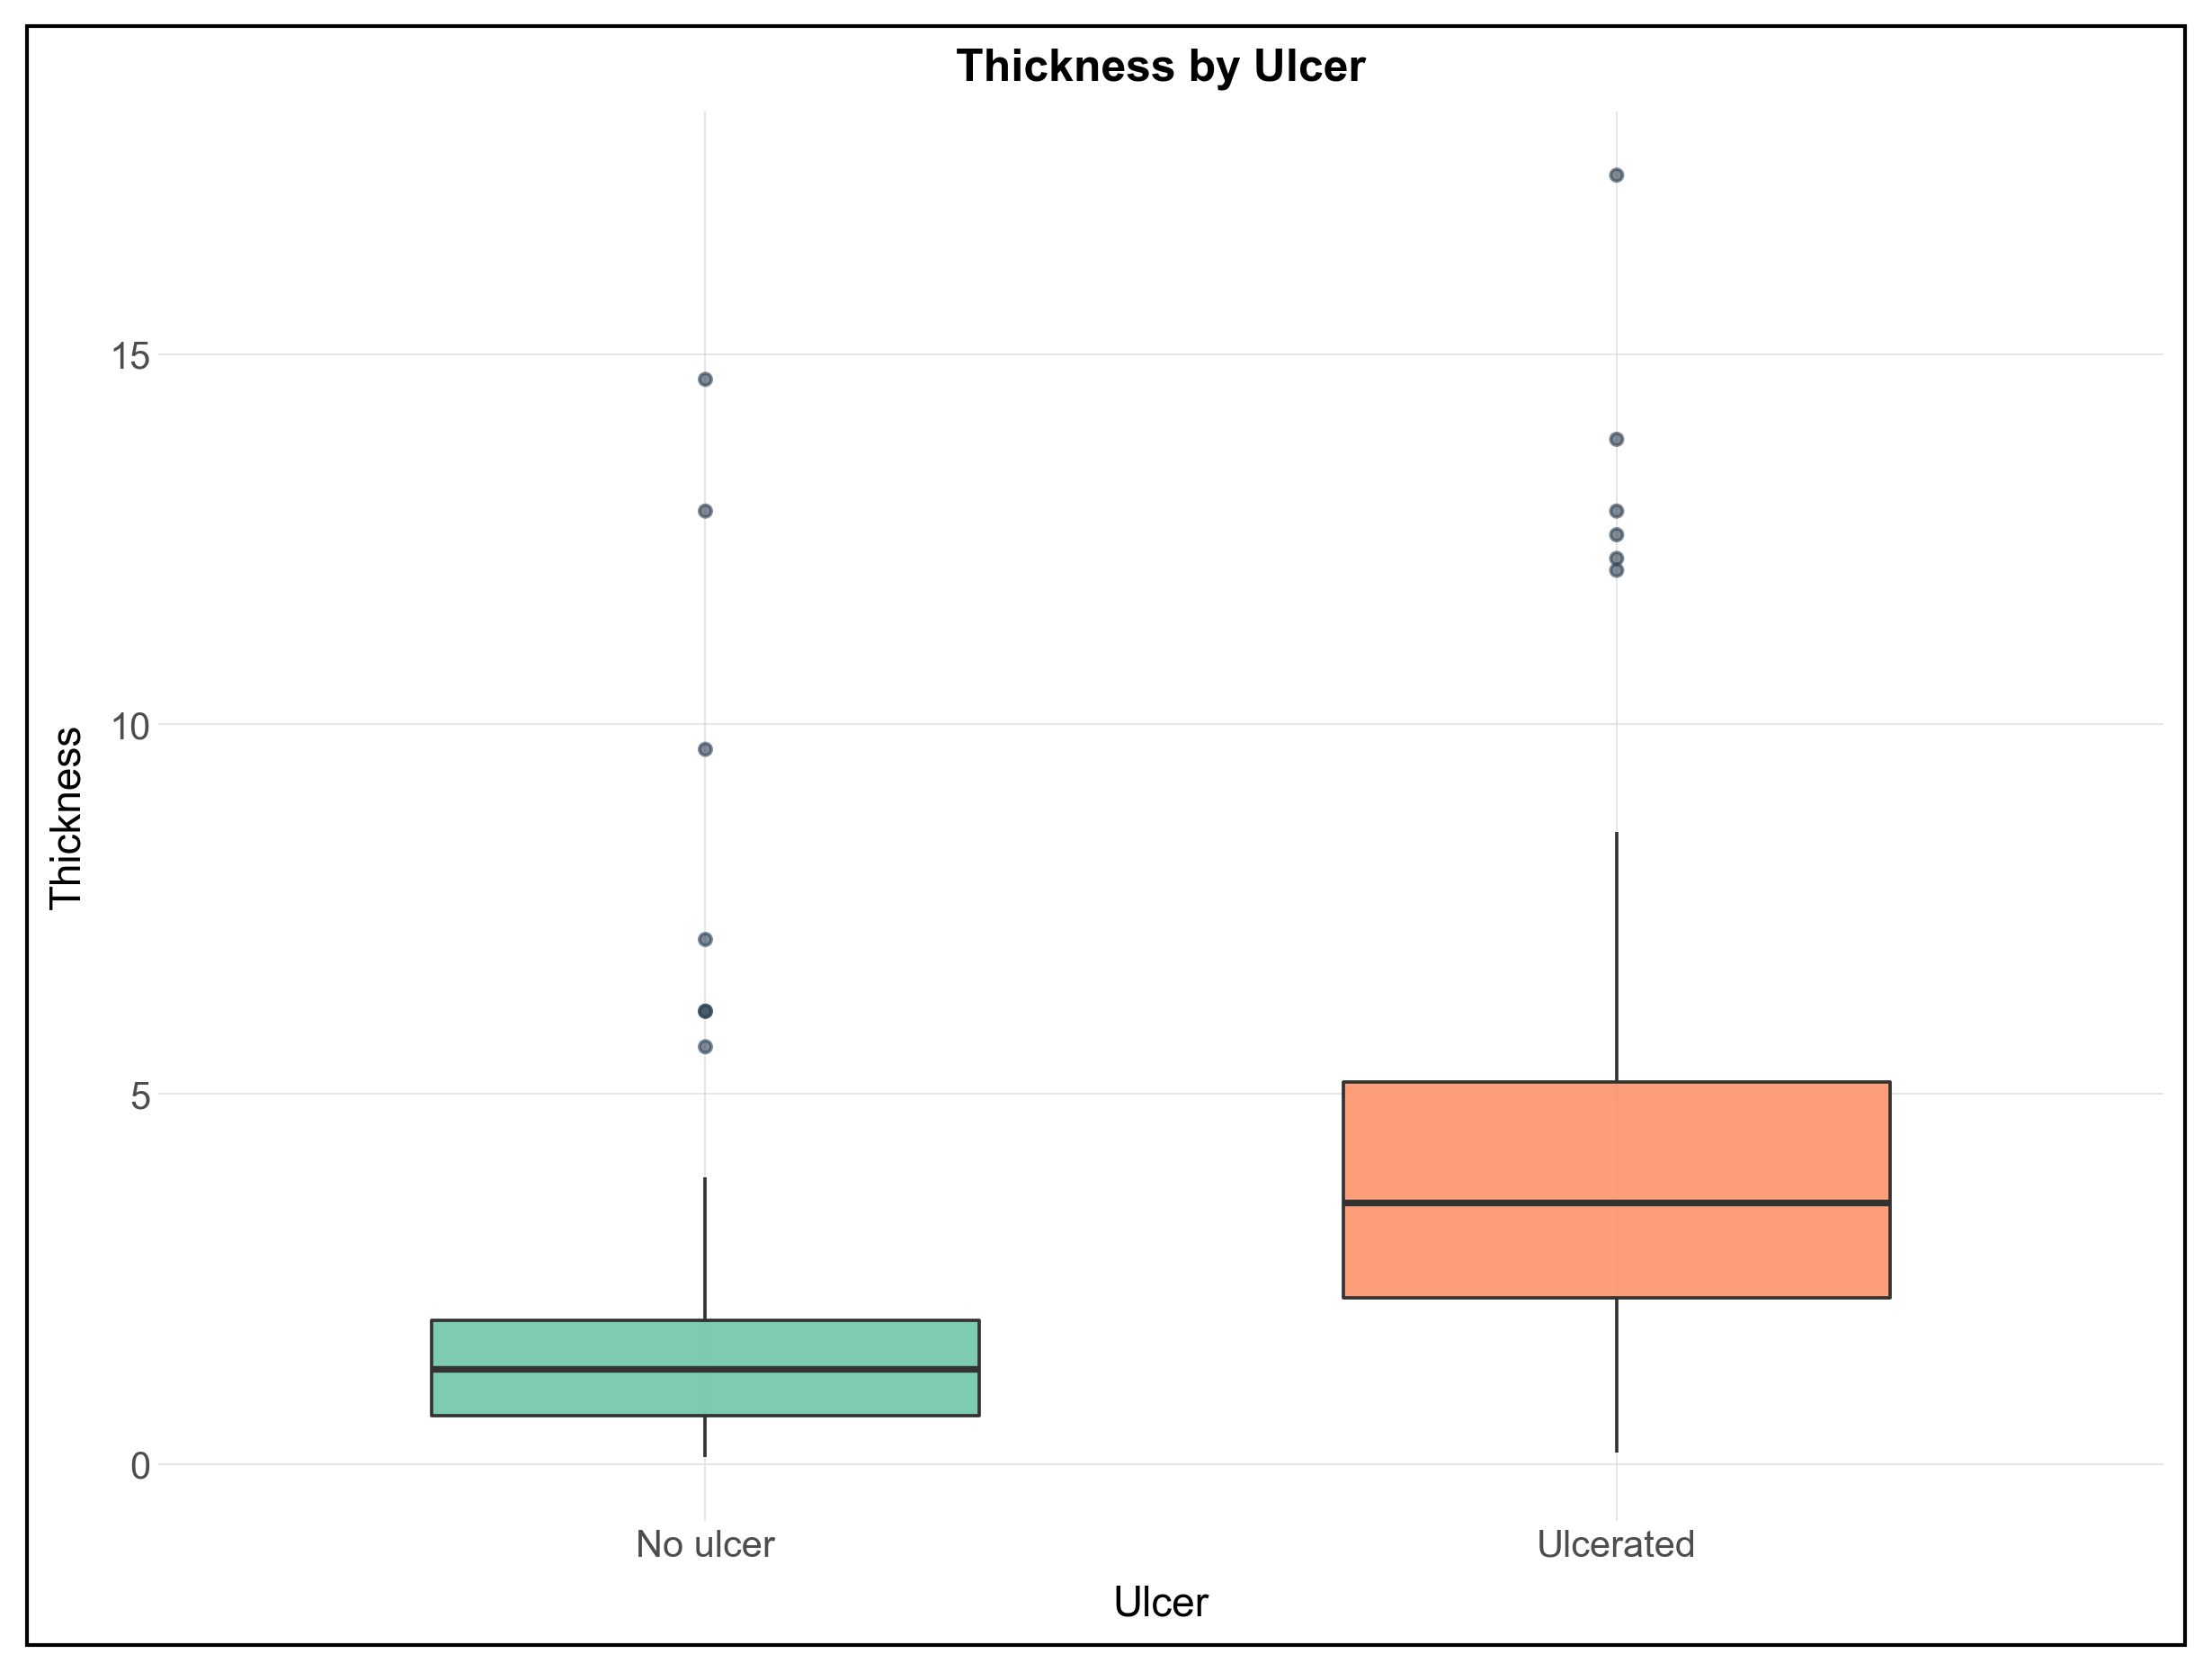
Mann-Whitney U · Melanoma survival study (n = 205)
Tumour thickness was greater in ulcerated melanomas (median 3.54 vs 1.29 mm); U = 8520; P < .001; r = 0.65.
Thickness was non-normal in both groups (Shapiro-Wilk P < .001), so Mann-Whitney U.
Download the data (CSV)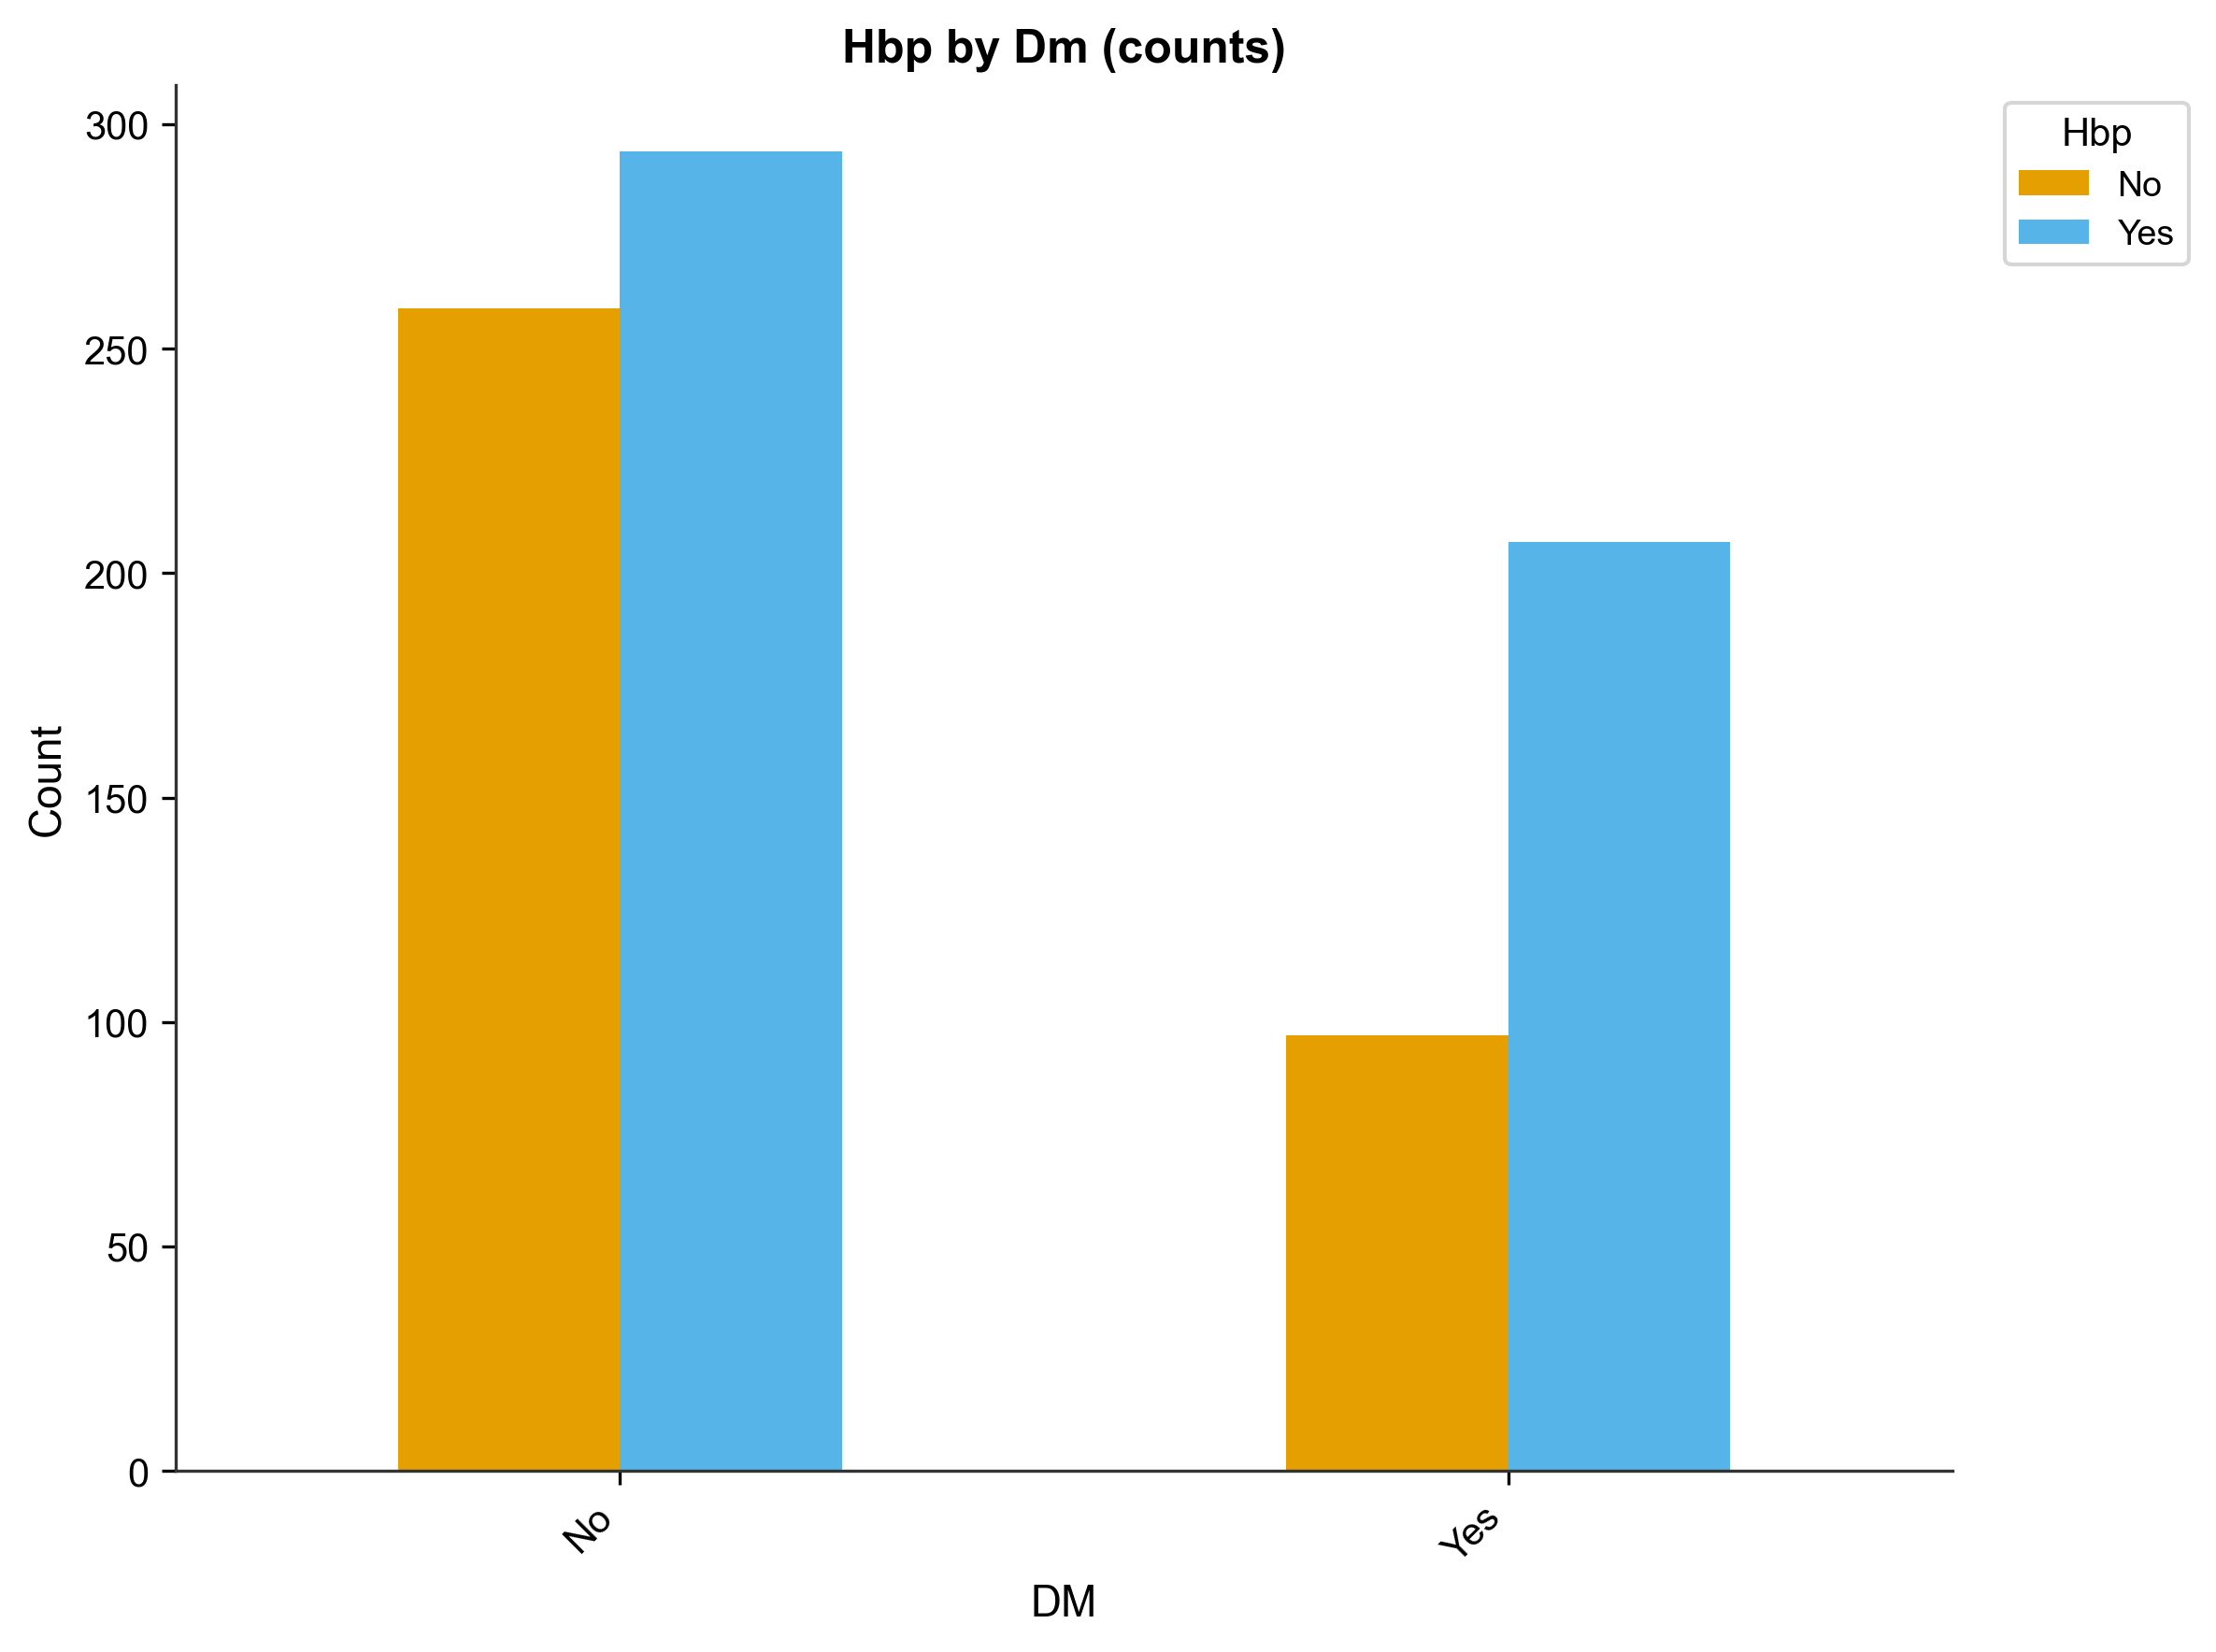
Chi-square · ACS patient cohort (n = 857)
Hypertension was more common among diabetic patients (68% vs 53%); χ²(1) = 18.00; P < .001; Cramér's V = 0.14.
Both variables categorical, so a chi-square test of independence.
Download the data (CSV)Conventions, stated up front
Statistical packages sometimes present the same correct result differently, for example in how degrees of freedom are reported. Where a convention differs, the pack documents the difference and tells you which output row to compare, so an apparent mismatch is never left unexplained.
Reproducibility
Run the same analysis on the same data twice and every number comes back identical, down to the last decimal. The numbers in your manuscript can be reproduced, by you, by a coauthor, or by a reviewer.
Same data, same tests, same numbers, every time. Download any dataset above and reproduce it yourself.